Insights Morning Brief
Morning Brief for Friday 11 September 2026
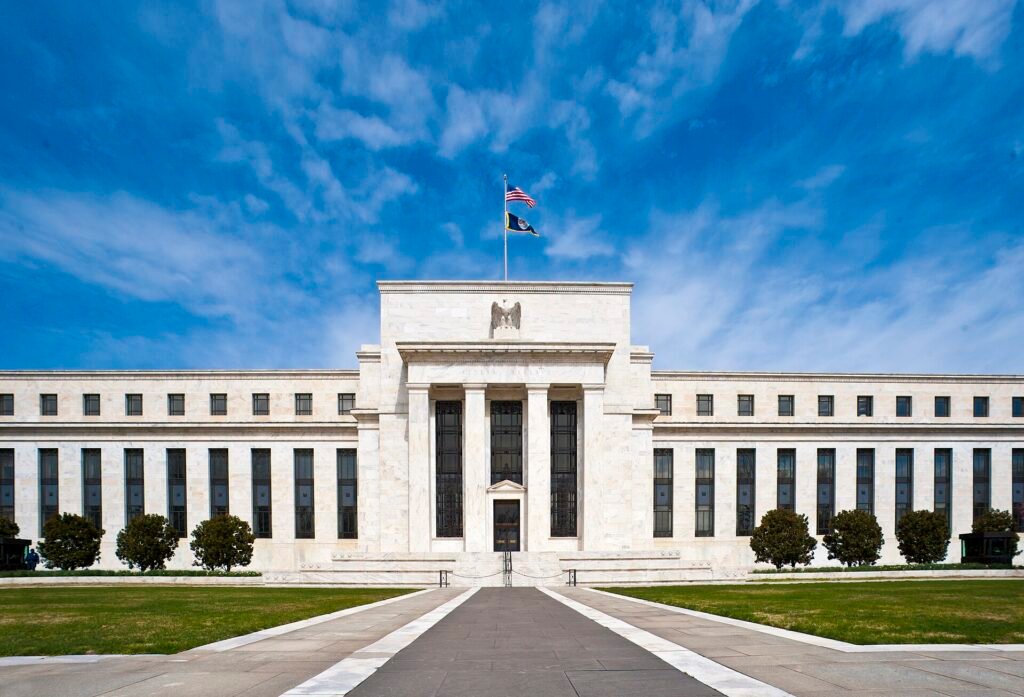
1 U.S. inflation stayed at 3.4% in August, and a Fed hike next week is now the base case
What happened
At 05:30 PT today the U.S. Bureau of Labor Statistics reported that consumer prices rose 0.4% in August and 3.4% over twelve months, the same annual rate as July. Core CPI, which leaves out food and energy, rose 0.3% in the month and 2.4% on the year. Gasoline rose 3.9% in August alone and is 27.4% higher than a year ago; the energy index is up 16.3% over twelve months. Shelter rose 0.3% in the month and 3.0% on the year, and food 2.7% on the year. This follows Thursday’s producer price report, which put wholesale inflation at 5.4% over twelve months.
Futures traders reacted quickly. By late morning CME FedWatch pricing showed about an 86% chance that the Federal Reserve raises its rate by 25 basis points on 16 September, up from a coin flip a month ago. The U.S. 10-year Treasury bond yieldBond yield The annual return an investor gets for lending to a government or company through a bond. Yields rise when bond prices fall. Fixed mortgage rates are priced from the 5-year Government of Canada yield. closed Thursday at 4.91%, its highest since 2023.
Canadian rates are following. The 5-year Government of Canada yield, the benchmark for fixed mortgage pricing, closed Wednesday at 3.48%, up 4 basis points on the day and about 30 basis points higher than a month ago. The 2-year was 3.16% and the 10-year 3.84%. The Bank of Canada’s overnight rate is 2.25%, unchanged since its 2 September hold, and the dollar bought 72.35 U.S. cents on Thursday.
Why it matters
Ottawa sets the overnight rate, but the bond market sets the fixed mortgage rate, and the Canadian bond market takes its cue from Washington. A 30 basis point rise in the 5-year yield over a month is roughly the difference between a 4.1% five-year fixed quote and a 4.4% one, on a $500,000 mortgage about $80 a month. The same move lifts what a 1- or 2-year GIC pays, so savers gain what borrowers lose. The next Canadian data point is Statistics Canada’s August CPI next week; the next Bank of Canada decision is 28 October.
Our view
Our view: a Fed hike on 16 September is now the base case, not the risk case, and Canadian fixed rates will stay near current levels through October whatever the Bank of Canada does. We think the Bank holds at 2.25% on 28 October because August’s loss of 42,000 jobs, with unemployment at 6.4%, and the trade dispute argue against following the Fed up, but we no longer see a Canadian cut this year. What would prove us wrong: a Fed hold next week, or the 5-year Canada yield back below 3.2%, which would mean the bond market has decided the energy shock is temporary.
What to consider
If a mortgage renewal or a purchase closes in the next 120 days, a rate hold with a lender costs nothing and protects against the direction yields are moving. If you hold cash for a purchase or an emergency fund, a 1-year GIC or a high-interest savings account now pays more than inflation, which was not true a year ago.
Where this connects
The planning question is how much of your household debt reprices in the next 24 months, and whether the budget still balances at a rate one full point above today’s. That answer, not the Fed’s, decides whether this week matters to you.
Array
2 Oil settled above US$100 for a second day as the Strait of Hormuz stays close to shut

What happened
Brent crude rose 3.6% on Thursday 10 September to settle at US$105.37 a barrel, and West Texas Intermediate rose 4.2% to US$100.10, the first close above US$100 for the U.S. benchmark since May. Brent briefly traded above US$108 during the session. The move follows a week of direct exchanges between U.S. and Iranian forces: U.S. forces destroyed five tankers linked to the Revolutionary Guards after Iranian attempts to attack American warships, and Iran fired missiles at U.S. targets in Jordan. Tanker traffic through the strait has averaged about 10 ships a day, against roughly 130 a day before the war.
Diesel is the sharper problem. In Thursday’s U.S. producer price report, diesel fuel rose 24.1% in a single month and the energy component of wholesale prices rose 4.2%. Retail gasoline in the U.S. is 27.4% higher than a year ago, and Canadian pump prices are priced off the same crude.
Why it matters
A barrel above US$100 reaches the pump within about two weeks and the grocery shelf within about two months, because diesel moves nearly everything that gets to a store. For a two-car household the fuel line is now running 15% to 20% above what a spring budget assumed. For a business that ships, delivers or runs equipment, fuel surcharges from carriers are coming and contracts signed at US$70 oil are underwater. The offset is narrow: energy producers, Alberta’s treasury and the Canadian dollar all benefit, and the TSX has more energy weight than most markets.
Our view
Our view: the market has moved from pricing a disruption to pricing a supply regime, and we expect Brent to hold above US$90 for as long as strait traffic is a fraction of normal. We also think the second-round effects, in shipping, food and airfares, will show up in Canadian inflation through the autumn even if crude stops rising. What would prove us wrong: strait traffic back above 100 ships a day for two consecutive weeks, or a ceasefire that holds; either would take US$15 to US$20 off the barrel quickly.
What to consider
Rebase the fuel and grocery lines of a household budget on today’s prices rather than last spring’s. A business owner should check whether customer contracts allow fuel surcharges to be passed through and whether supplier contracts allow suppliers to pass them on to you; the asymmetry is where margin disappears.
Where this connects
The planning question is how much of monthly household or business spending is exposed to energy prices and interest rates at the same time: commuting, heating, a variable-rate loan and a renewal in the next year all move the same way in a week like this one.
Array
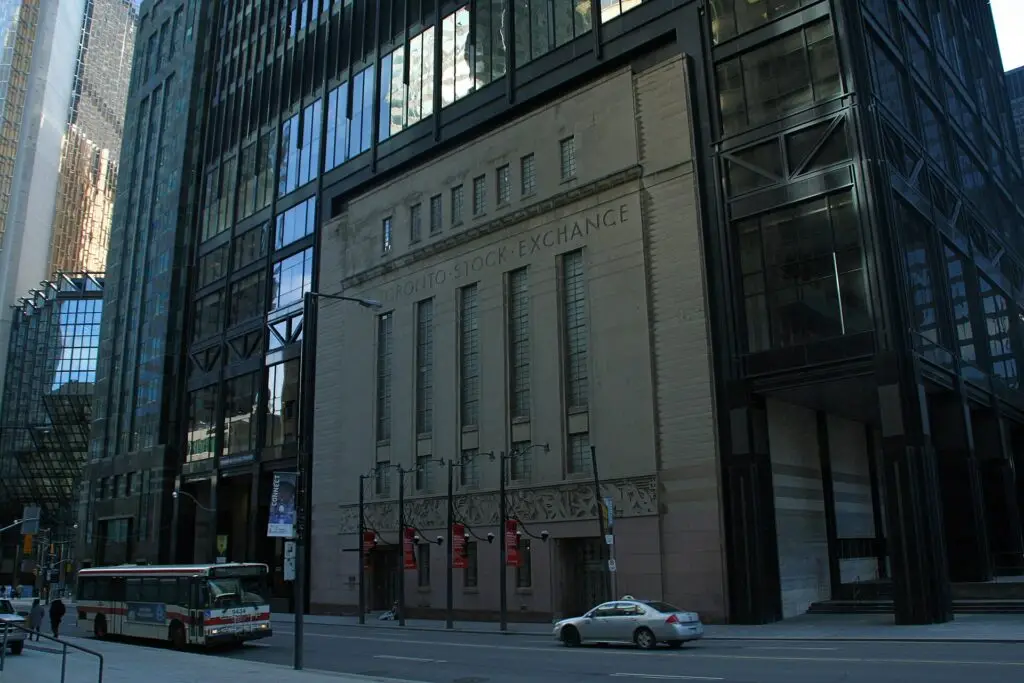
3 Stocks fell for a fourth day: the TSX lost 1.1% as yields and oil squeezed valuations
What happened
The S&P/TSX Composite fell 400.28 points, or 1.11%, to 35,506.28 on Thursday, a one-month low and its fourth straight loss. Materials led the decline, down 3.54%, as gold fell 2.28% to about US$4,359 an ounce; utilities lost 1.75% and energy 1.08%. Financials was the only sector to close higher. In New York the S&P 500 fell 0.6% to 7,591.70, the Dow 0.6% to 52,064.10, the Nasdaq 0.7% to 26,081.72 and the Russell 2000 1.0%. For the week the S&P 500 is down 1.6% and the Dow 2.5%; for the year the S&P 500 is still up 10.9% and the Nasdaq 12.2%.
The pressure is coming from bonds. The U.S. 10-year yield at 4.91% is the highest since 2023, and on Wednesday the European Central Bank raised its three policy rates by 25 basis points, taking the deposit rate to 2.50% from 16 September, after euro-area inflation rose to 3.3% in August. Bitcoin was US$76,865 on Thursday evening, down 1.5% on the day.
Why it matters
Most Canadian portfolios are now more foreign than domestic, so a bad week in New York matters more to a Canadian RRSP than a bad week on Bay Street. Four down days after a strong year is a normal pullback, not a signal, but the cause is worth noting: when a government bond pays 4.9%, stocks have to earn it, and the sectors that behave like bonds, utilities, real estate, gold, fall first. Gold falling with stocks is a reminder that it is not a reliable hedge when the problem is rising real yields.
Our view
Our view: this is a repricing of interest rates, not of earnings, and drawdowns of 5% to 10% in a year that is still up double digits are the cost of holding equities, not a reason to sell them. We would treat the coming week, with the Fed on 16 September, as the point where the market decides whether a hike is one-and-done or the start of a cycle. What would prove us wrong: corporate credit spreads widening sharply or a run of guidance cuts in the coming earnings season; either would make this an earnings story and change our position.
What to consider
Confirm that any money you need in the next 12 months, a tax bill, a tuition payment, a down payment, is not sitting in equities. If your asset mix has drifted more than 5 percentage points from its target after a strong year, this is a rebalancing decision rather than a market call, and the account it sits in, RRSP, TFSA or taxable, decides whether it costs tax to make.
Where this connects
The planning question is whether the target asset mix was written down before this week, and whether it was chosen with a 10% drawdown in mind. A portfolio that was never designed for one gets redesigned at the bottom.
Array
4 Household net worth rose 2.9% to $19.1 trillion, and debt ratios fell, but the gains came from stocks, not homes

What happened
Statistics Canada’s national balance sheet for the second quarter, released this morning, puts household net worth at $19.1 trillion, up 2.9% in the quarter, or $462,336 a person. The gain came from financial assets: households bought $53.8 billion of mutual fund units in the quarter while the value of residential real estate rose only 0.4% and is 0.3% lower than a year earlier. Households borrowed $19.4 billion in new mortgages, the slowest pace since the first quarter of 2024, and $10.0 billion in consumer credit, $2.3 billion less than the quarter before. The ratio of credit market debt to disposable income fell to 176.4% from 178.6%, and the debt service ratio, the share of after-tax income going to interest and principal, eased to 14.52%. The household saving rate was 3.7%.
The distribution is uneven: the wealthiest fifth of households holds 69.0% of financial assets and 49.7% of non-financial assets. On the government side, federal net financial liabilities are 33.3% of GDP, and Wednesday’s companion release showed non-residents now hold 44.6% of federal government bonds, up from 27.0% in early 2021.
Why it matters
The headline says Canadians got richer; the detail says which Canadians. A household whose wealth is mostly a home saw no gain this quarter, while one with a large investment account did. The improving debt ratios are the better news for everyone: borrowing has slowed, repayments are being made, and the national debt service ratio of 14.5% is a benchmark you can measure yourself against. The 44.6% foreign ownership of federal bonds is a quieter point: it means Canadian mortgage rates depend on foreign buyers continuing to want Canadian debt, which is one reason our yields track U.S. yields so closely.
Our view
Our view: household balance sheets are in better shape than the headlines about debt suggest, and the deleveraging is real. We do not expect the third quarter to repeat the second: the stock gains that drove this quarter’s net worth have partly reversed this week and yields have risen. What would prove us wrong: a third-quarter release showing net worth still rising with debt ratios still falling, which would mean households are absorbing higher rates without cutting saving.
What to consider
Work out your own debt service ratio: total monthly debt payments, mortgage included, divided by monthly after-tax income. The national average is 14.5%. If yours is above 20% and a mortgage renewal falls in the next two years, the time to adjust spending or extend amortization is before the renewal, not after.
Where this connects
A personal net-worth statement once a year, splitting home equity from financial assets, answers the question this release raises for the whole country: whether your wealth is diversified or is one asset in one city.
Array
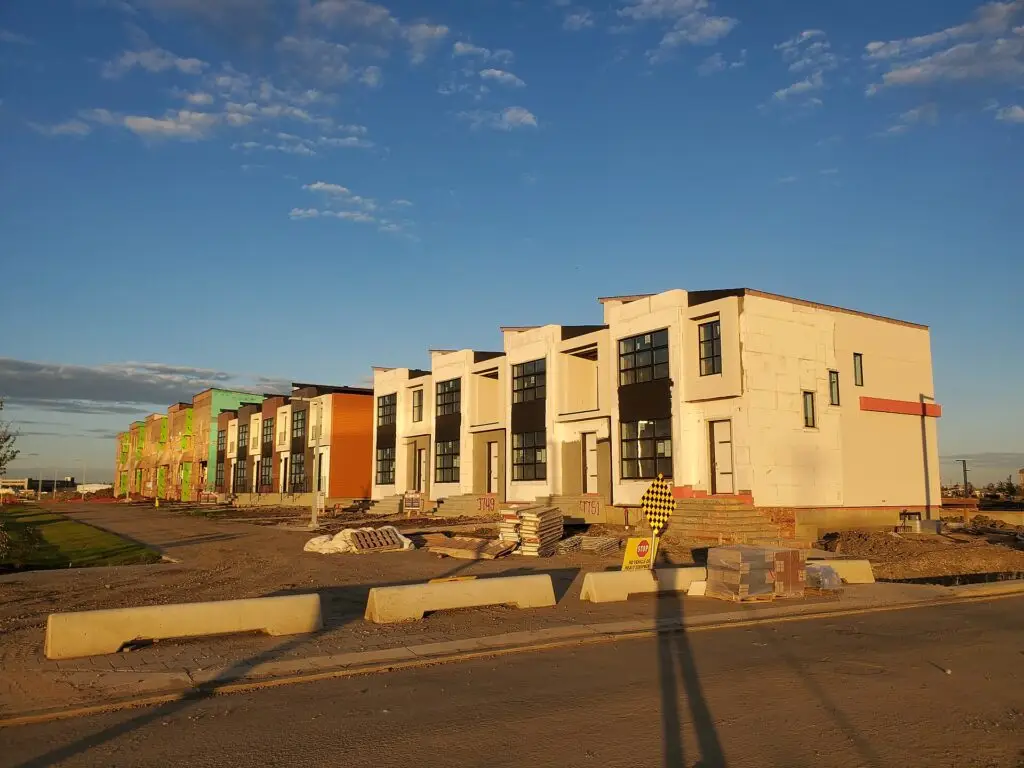
5 CMHC says Canada needs 417,000 to 469,000 homes a year and is building about half that
What happened
Canada Mortgage and Housing Corporation published its Fall 2026 Housing Supply Report on Wednesday 10 September. Its estimate: to return housing costs to 2019 levels of affordability by 2036, Canada needs 187,000 to 238,000 homes a year beyond what it would build anyway, or 417,000 to 469,000 total starts a year, roughly 4.69 million homes over the decade. That is slightly below the July 2025 estimate of 430,000 to 480,000 because slower population growth has eased demand. Actual starts through July 2026 were 131,851, down 4% from a year earlier, a pace of about 231,000 a year.
The picture differs by city. Toronto’s supply gap narrowed because prices fell, but condo construction there has weakened sharply. Calgary nearly halved its gap through record building. Edmonton is the only major market with no measurable gap. Montréal has the largest gap, Ottawa’s widened, and Vancouver’s was unchanged. CMHC’s deputy chief economist warned that the key risk is that Canada underbuilds during this softer market and finds itself further short when demand returns.
Why it matters
Prices are soft now, Statistics Canada put residential real estate 0.3% lower than a year ago this morning, and rents are falling in the big western cities. CMHC’s point is that this is a pause, not a fix: the homes not started in 2026 are the homes not completed in 2028 and 2029. For a buyer that means today’s softer market is a window rather than a new normal. For an owner it means the long-run floor under prices is intact. For a condo investor in Toronto it means the pipeline is thinning, which supports rents later but says nothing about the mortgage renewal now.
Our view
Our view: the soft patch in Canadian housing is cyclical and the shortage is structural, and the two can coexist for another year or two. We expect prices in Toronto and Vancouver to stay flat to lower through 2027 while fixed rates sit in the low-4% range, then for supply to reassert itself. What would prove us wrong: starts running above 280,000 a year for two consecutive quarters, or population growth slowing further than the 2026 immigration targets imply; either would close the gap faster than CMHC assumes.
What to consider
A buyer should qualify the purchase at a rate at least 1.5 points above the contract rate and buy for a horizon of seven years or more, not for a rebound. A renter in a city where asking rents are falling can negotiate a longer lease now. An owner planning to downsize should note that the buyers for a family home are the households most squeezed by today’s rates.
Where this connects
Whether to buy, hold or sell a home is a plan question before it is a market question: the time horizon, the cash flow at a stress-tested rate, and what the down payment would otherwise earn decide it, and those do not change with one report.
Array
| 05:30 PT | U.S. Consumer Price Index, August (released: +0.4% m/m, 3.4% y/y; core +0.3% m/m, 2.4% y/y) | 3.4% y/y, core 0.2% m/m |
| 05:30 PT | Statistics Canada: National balance sheet and financial flow accounts, Q2 (released: household net worth +2.9%) | |
| 07:00 PT | ECB President Lagarde speaks | |
| 07:00 PT | U.S. University of Michigan consumer sentiment, September preliminary | 51.0 |
| 07:00 PT | U.S. University of Michigan 1-year inflation expectations, preliminary | |
| 11:00 PT | U.S. federal budget balance, August | -US$221.1B |
| 16 Sep | U.S. Federal Reserve rate decision | About 86% odds of +25 bp (CME FedWatch) |
| 16 Sep 10:30 PT | Bank of Canada summary of deliberations (2 September decision) | |
| 28 Oct | Bank of Canada rate decision and Monetary Policy Report | Hold at 2.25% |
Glossary today: basis point bond yieldBond yield The annual return an investor gets for lending to a government or company through a bond. Yields rise when bond prices fall. Fixed mortgage rates are priced from the 5-year Government of Canada yield. overnight rate RRSP TFSA
Sources
- Statistics Canada, The Daily: Labour Force Survey, August 2026, 2026-09-04
- U.S. Bureau of Labor Statistics, Consumer Price Index Summary, August 2026, 2026-09-11
- U.S. Bureau of Labor Statistics, Producer Price Index News Release, August 2026, 2026-09-10
- 24/7 Wall St., With Just 5 Days to Next FOMC Meeting, Odds of Fed Rate Hike Surge to Over 85%, 2026-09-11
- Yahoo Finance, Stock market today: Dow, S&P 500, Nasdaq fall for fourth straight day as bond yields jump, oil stays above $100, 2026-09-10
- Ascenthya market feed, Bank of Canada Valet data, 9 September close (yields) and 10 September (CAD, crypto), 2026-09-10
- Bank of Canada, Bank of Canada maintains the policy rate at 2¼%, 2026-09-02
- Bank of Canada, Upcoming events, 2026-09-11
- TheStreet, Stock Market Today (Sept. 10, 2026): S&P 500, Nasdaq decline as Brent oil hits highest point since July, 2026-09-10
- The Associated Press (via ABC News), How major US stock indexes fared Thursday 9/10/2026, 2026-09-10
- CBS News, U.S. forces hit IRGC-linked oil tankers as oil nears $100 a barrel, 2026-09-08
- The Canadian Vanguard, Market Indexes Retreat as Rising Treasury Yields and Oil Prices Weigh on Sentiment, 2026-09-10
- Investing.com, Canada stocks lower at close of trade; S&P/TSX Composite down 1.11%, 2026-09-10
- European Central Bank, Monetary policy statement, 10 September 2026, 2026-09-10
- European Central Bank, Key ECB interest rates, 2026-09-10
- Statistics Canada, The Daily: National balance sheet and financial flow accounts, second quarter 2026, 2026-09-11
- Statistics Canada, The Daily: Canada’s international investment position, second quarter 2026, 2026-09-10
- Canada Mortgage and Housing Corporation, Fall 2026 Housing Supply Report, 2026-09-10
- The Canadian Press (via BNN Bloomberg), Canada needs up to 4.69 million new homes by 2036, but construction could slow: CMHC, 2026-09-10
- Canadian Mortgage Trends, Canada needs up to 4.69 million new homes by 2036, but construction could slow: CMHC, 2026-09-10
- Forex Factory, Economic calendar, 11 September 2026, 2026-09-11
Important disclosure information
All information in this material is as of 11 September 2026 unless otherwise indicated. Market figures shown in the live rails are supplied by the sources named beneath them and may be delayed.
See moreSee less
This material is prepared by the Ascenthya Research Desk for informational and educational purposes only. It is general in nature and does not take into account the objectives, financial situation or needs of any particular person. It may be shared by link, but may not be copied, reproduced, republished or distributed in whole or in part, or altered in any way, without the prior written consent of Ascenthya (together with its affiliates, “Ascenthya”).
The views and opinions expressed are those of the Ascenthya Research Desk as of the date shown. They may not reflect the views of Ascenthya as a firm, are subject to change at any time without notice, and Ascenthya has no obligation to update them. Where a view is labelled as a house view, it is an opinion, not a forecast, and the conditions that would change it are stated alongside it.
Nothing in this material constitutes an offer, solicitation or recommendation to buy or sell any security, insurance product or other financial instrument, or to adopt any investment, tax, estate, insurance or financing strategy. It is not an invitation to enter into any transaction and shall not form the basis of, or be relied upon in connection with, any contract or commitment. Products and services are offered only where Ascenthya and its advisors are licensed to do so, and only after a personal assessment of suitability.
This material is not intended to provide, and should not be relied upon for, legal, tax, accounting or investment advice. Readers should obtain advice from their own qualified professionals about their particular circumstances before acting on anything in this material.
There can be no assurance that any trend described in this material will continue or will not reverse. Past events and past performance are not indicative of future events or results. Certain statements may be forward looking in nature; such statements are identified by words such as “expect”, “think”, “would”, “likely”, “may” or similar terms, involve risks and uncertainties, and actual events or results may differ materially from those contemplated. Undue reliance should not be placed on them.
Information obtained from third parties, including government and central bank releases, news organisations and market data providers, is believed to be reliable but has not been independently verified. Ascenthya makes no representation or warranty, express or implied, as to its accuracy, completeness or timeliness, and accepts no liability for any loss arising from its use. Sources are cited so that readers may consult the original releases.
This material may reference the names, trade names or trademarks of companies and institutions that are not affiliated with Ascenthya. Such references are for identification only and do not imply any relationship with, or endorsement by, those parties. Photographs are used under the licence stated in their credit line.
© 2026 Ascenthya. All rights reserved.